今天小编为大家带来matlab三维绘图
01
本期主题介绍
The topic of this issue
如果您了解过Matlab,
您肯定知道Matlab不只是计算!
Matlab还有一个强大的绘图功能!
本期话题将对matlab的三维图进行介绍。
请感兴趣的朋友和小编开启
学习Matlab的三维绘图之旅吧!
If you know Matlab,
You must know that Matlab is more than just computing!
Matlab also has a powerful drawing function!
The topic of this issue will introduce the three-dimensional drawing of matlab.
Please open it with interested friends and editors
Learn the journey of two-dimensional drawing in Matlab
02
Matlab三维绘图
Matlab 3D drawing
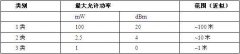
1.用plot绘制三维图形
Use plot to draw three-dimensional graphics
x=1:5;
y=6:10;
z=x+y;
z2=exp(x+y);
[x3,y3]=meshgrid(x,y);
z3=x3+y3;
plot3(x,y,z);
plot3(x,y,z2);
plot3(x3,y3,z3);
%mesh可以绘制一段区间的曲面,调用格式mesg(x,y,z)
%注意:在使用函数前,先对xy平面建立网格坐标:[x,y]=meshgrid(x,y)
%其中meshgrid为二维三维网格
mesh can draw a section of curved surface, call the format mesg(x,y,z)
Note: Before using the function, create grid coordinates on the xy plane: [x,y]=meshgrid(x,y)
Where meshgrid is a two-dimensional three-dimensional grid
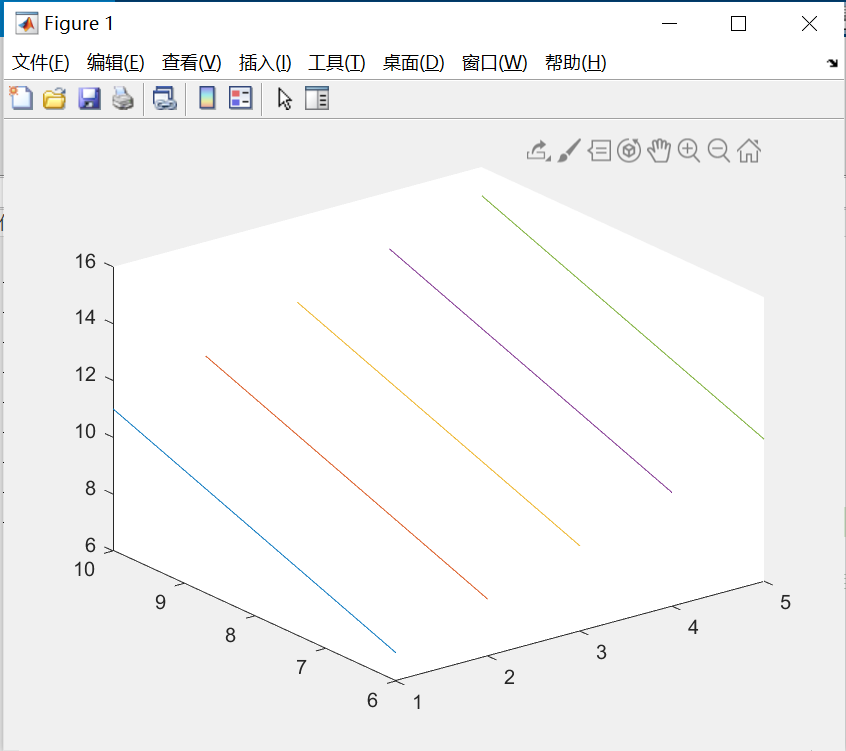
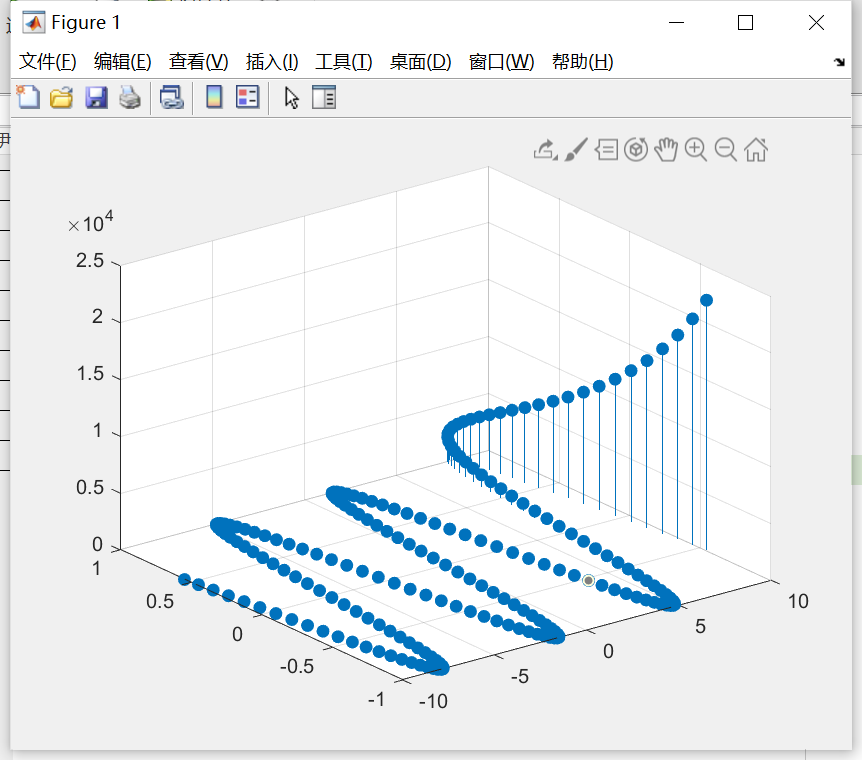
2.绘制螺旋图
Draw a spiral graph
t=0:pi/60:10*pi;
x=sin(t);
y=cos(t);
plot3(x,y,t,'*-b');
3.三维网格图
Three-dimensional grid map
mesh函数用于绘制三维网格图,其调用语法如下。
(1)mesh(x,y,z):绘制三维网格图,x、y、z 分别表示三维网格图形在 x 轴、y 轴和 z 轴 的坐标,图形的颜色由矩阵 z 决定。mesh(Z):绘制三维网格图,分别以矩阵 Z 的列下标、行下标作为三维网格图的 x 轴、y 轴的坐标。
注意事项:在使用函数前,需要先在xy平面建立网格坐标:[x,y]=meshgrid(x,y),然后再利用新的x,y计算网格上对应z的点,从而得到构建曲面所需的点,最后再使用mesh绘制整个图。
The mesh function is used to draw a three-dimensional grid graph, and its calling syntax is as follows.
(1) mesh(x,y,z): draw a three-dimensional grid graph, x, y, z represent the coordinates of the three-dimensional grid graph on the x-axis, y-axis and z-axis, respectively. The color of the graph is determined by the matrix z. mesh(Z): Draw a three-dimensional grid graph, and use the column subscripts and row subscripts of matrix Z as the coordinates of the x-axis and y-axis of the three-dimensional grid graph.
Note: Before using the function, you need to establish the grid coordinates in the xy plane: [x,y]=meshgrid(x,y), and then use the new x,y to calculate the point corresponding to z on the grid to get Construct the points needed for the surface, and finally use the mesh to draw the entire graph.
x=-8:8;
y=-8:8;
[X,Y]=meshgrid(x,y);
Z=(X.^2/4^2-Y.^2/5^2);
meshz(X,Y,Z)
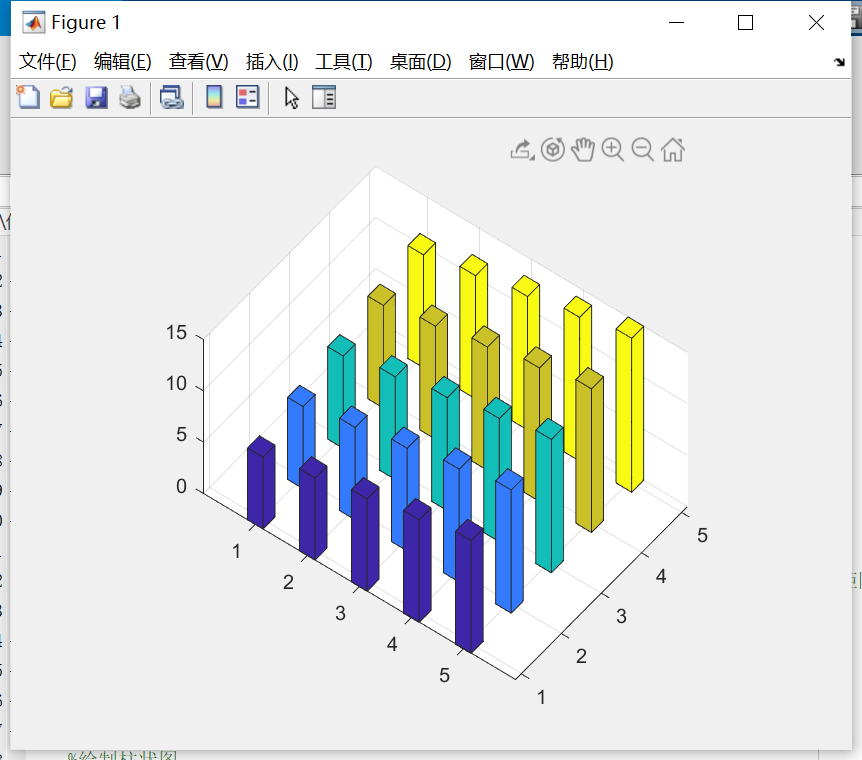
4.绘制柱状图
Draw a histogram
bar3(x,y,z);
bar3(z3);
bar3(z3,'grouped')
bar3(z3,'stacked')
bar3(z3,0.3)
5.绘制直方图
Draw a histogram
%X = randn 返回一个从标准正态分布中得到的随机标量。
%X = randn(n) 返回由正态分布的随机数组成的 n×n 矩阵。
%X = randn(sz1,...,szN) 返回由随机数组成的 sz1×...×szN 数组,其中 sz1,...,szN 指示每个维度的大小。例如:randn(3,4) 返回一个 3×4 的矩阵。
%histogram为绘制直方图
%X = randn returns a random scalar obtained from the standard normal distribution.
%X = randn(n) returns an n×n matrix composed of normally distributed random numbers.
%X = randn(sz1,...,szN) returns an sz1×...×szN array composed of random numbers, where sz1,...,szN indicate the size of each dimension. For example: randn(3,4) returns a 3×4 matrix.
%histogram is to draw a histogram
x4=randn(100,1);
y4=randn(100,1);
histogram2(x4,y4);

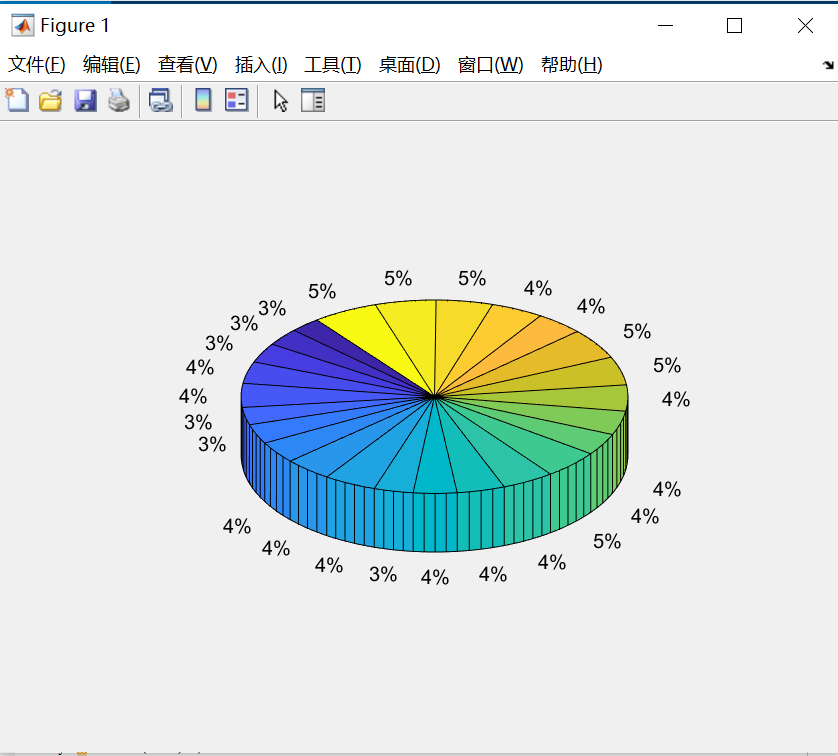
6.绘制饼图
Draw a pie chart
pie3(z3)
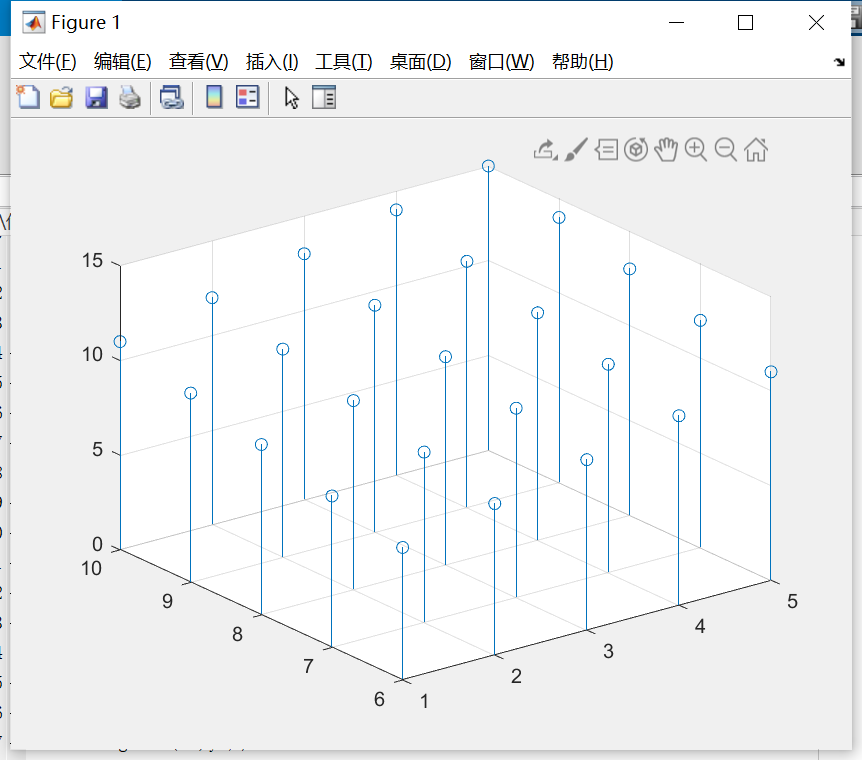
7.绘制“火柴杆图”
Draw a "matchstick map"
%火柴杆数
% Matchsticks
stem3(x3,y3,z3)
t=-10:0.1:10;
xt=t;
yt=sin(t);
zt=exp(t);
stem3(xt,yt,zt,'filled');
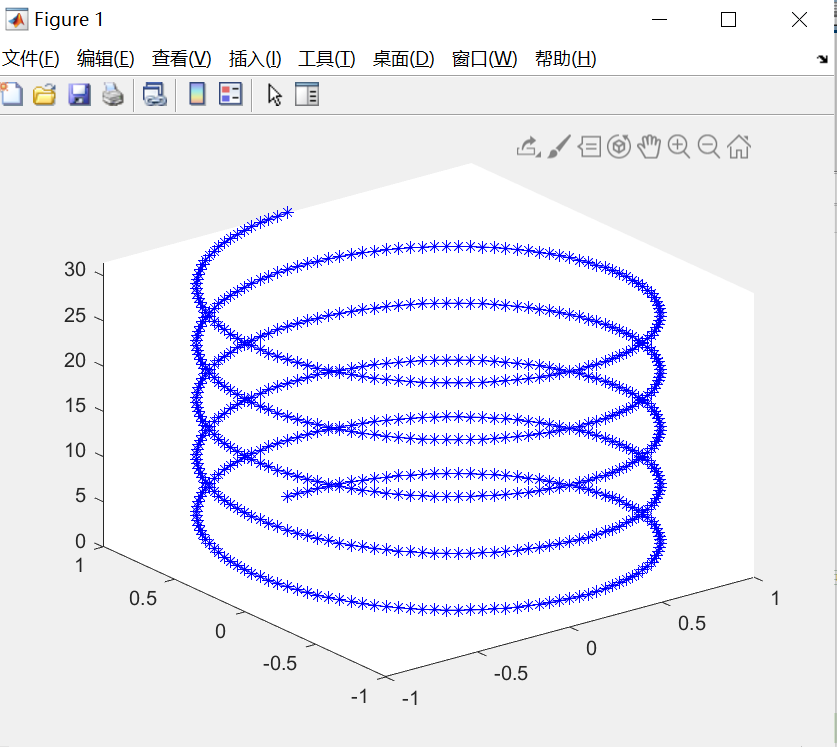
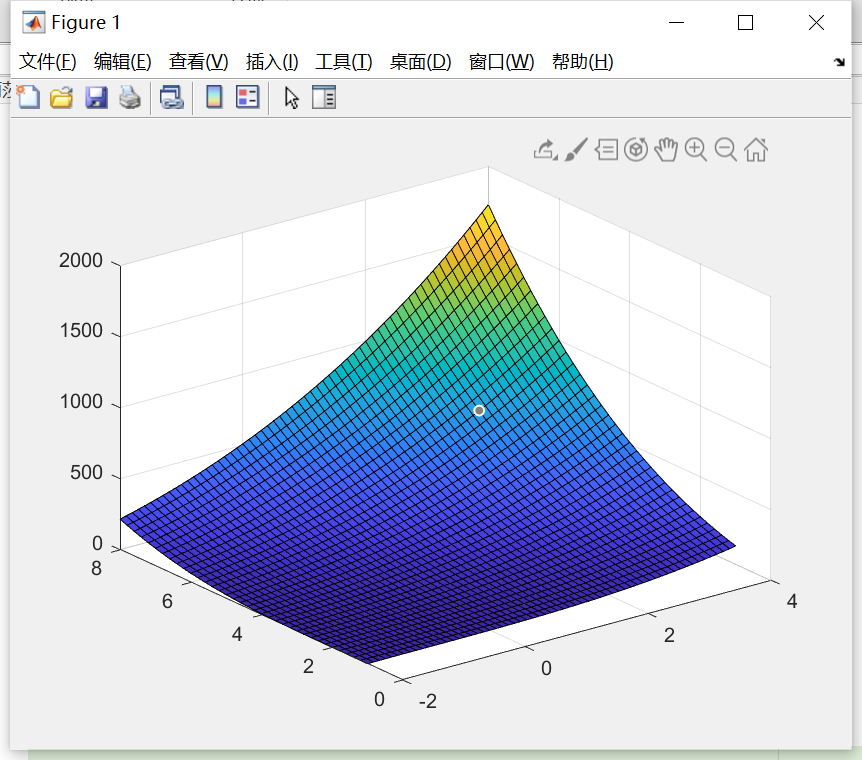
8.空间曲面绘图
Space surface drawing
%suf 空间曲面绘图
%surf(x,y,z)画出数据点x,y,z表示的曲面
%画出z=(x+y)^2
%suf space surface drawing
%surf(x,y,z) draws the surface represented by data points x,y,z
%Draw out z=(x+y)^2
x=-2:0.1:4;
y=1:0.2:8;
[x,y]=meshgrid(x,y);
z=(x+y).^3;
surf(x,y,z)
shaing flat
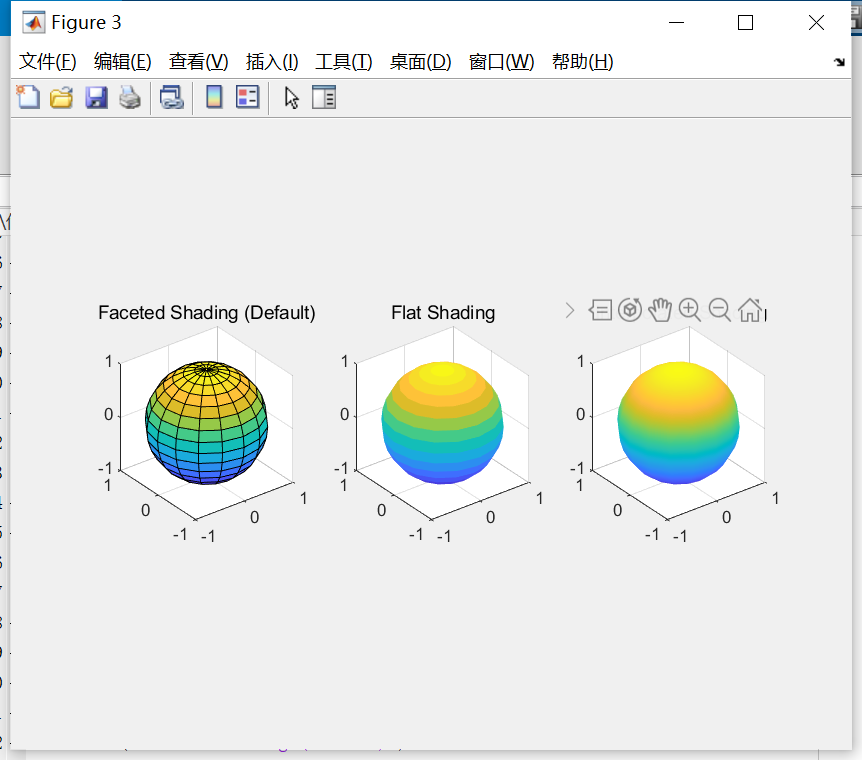
9.subplot的使用,以及shading自由设置图形表面的颜色
The use of subplot and shading freely set the color of the graphic surface
%shaing flat 使用同一种颜色配色
%shading interp 插值处理方式配色
%shaing flat uses the same color
%shading interp color matching
figure
subplot(1,3,1)
sphere(16)
axis equal
title('Faceted Shading (Default)')
subplot(1,3,2)
sphere(16)
shading flat
axis equal
title('Flat Shading')
subplot(1,3,3)
sphere(16)
shading interp
axis equal
title ('iInterpolated Shading')
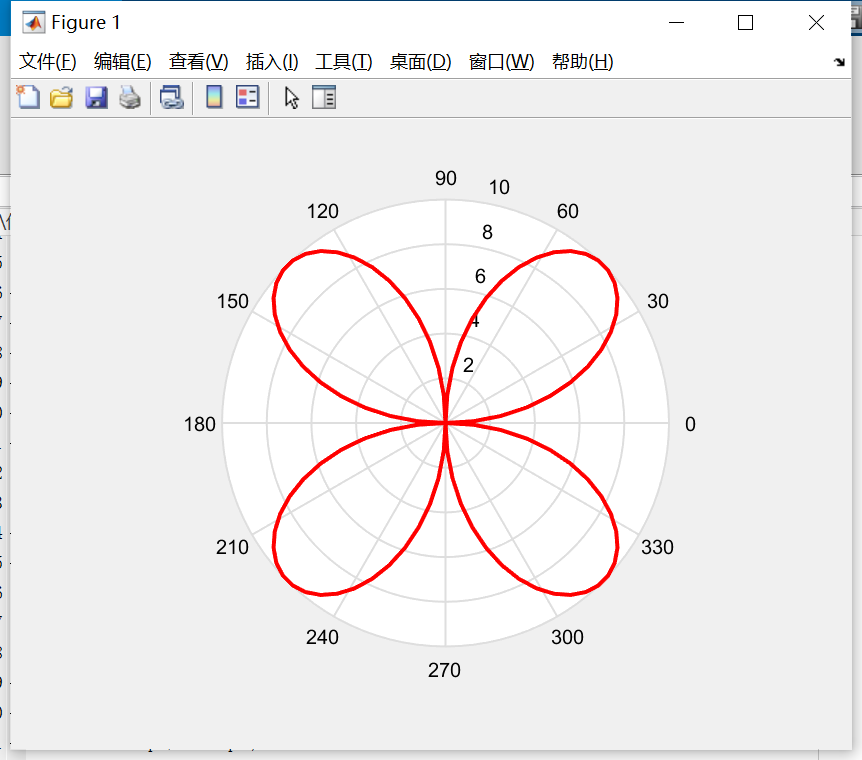
10.绘制极坐标图
Draw polar coordinates
a=10
k=2
theta=0:pi/50:2*pi;
r=a*sin(k*theta);
h=polar(theta,r)
set(h,'color',[1,0,0],'LineWidth',2)
今天的分享就到这里了。