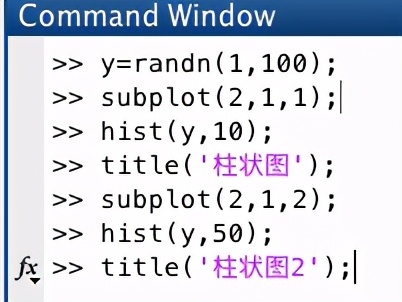
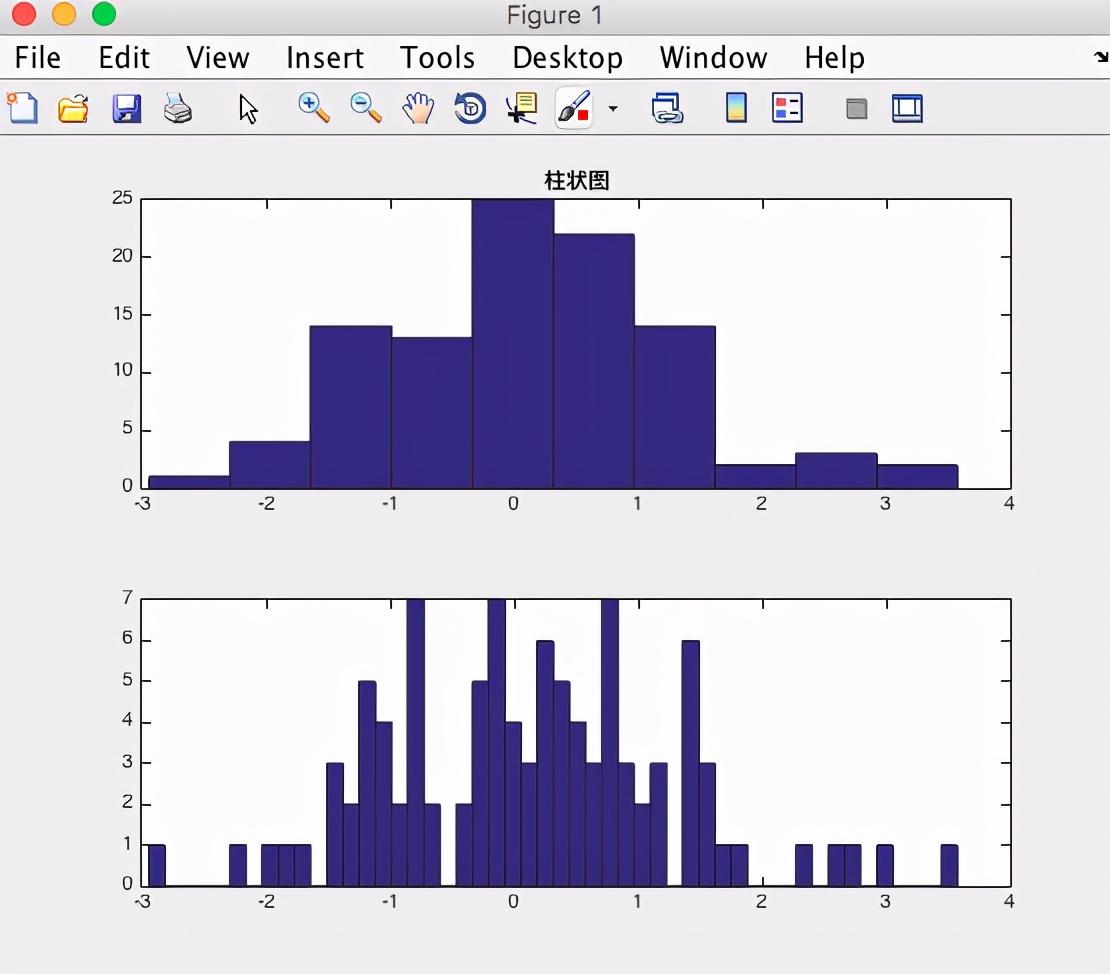
Part 1直方图的绘制
hist(a,b)
a为要绘制的变量,b为柱形的个数。
subplot(a,b,c)显示图像的位置布局,显示b行a列个图像,此图像是其中的第c个。
hist(a,b)
a is the variable to be drawn, and b is the number of bars.
subplot(a,b,c) displays the position layout of the image, displaying images in row b and column a, and this image is the cth image.
例:
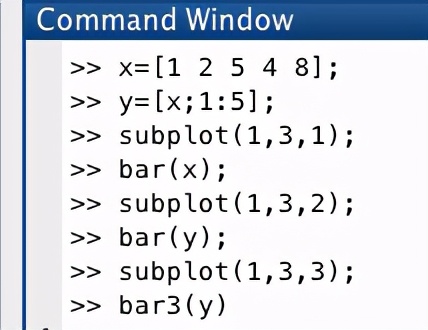
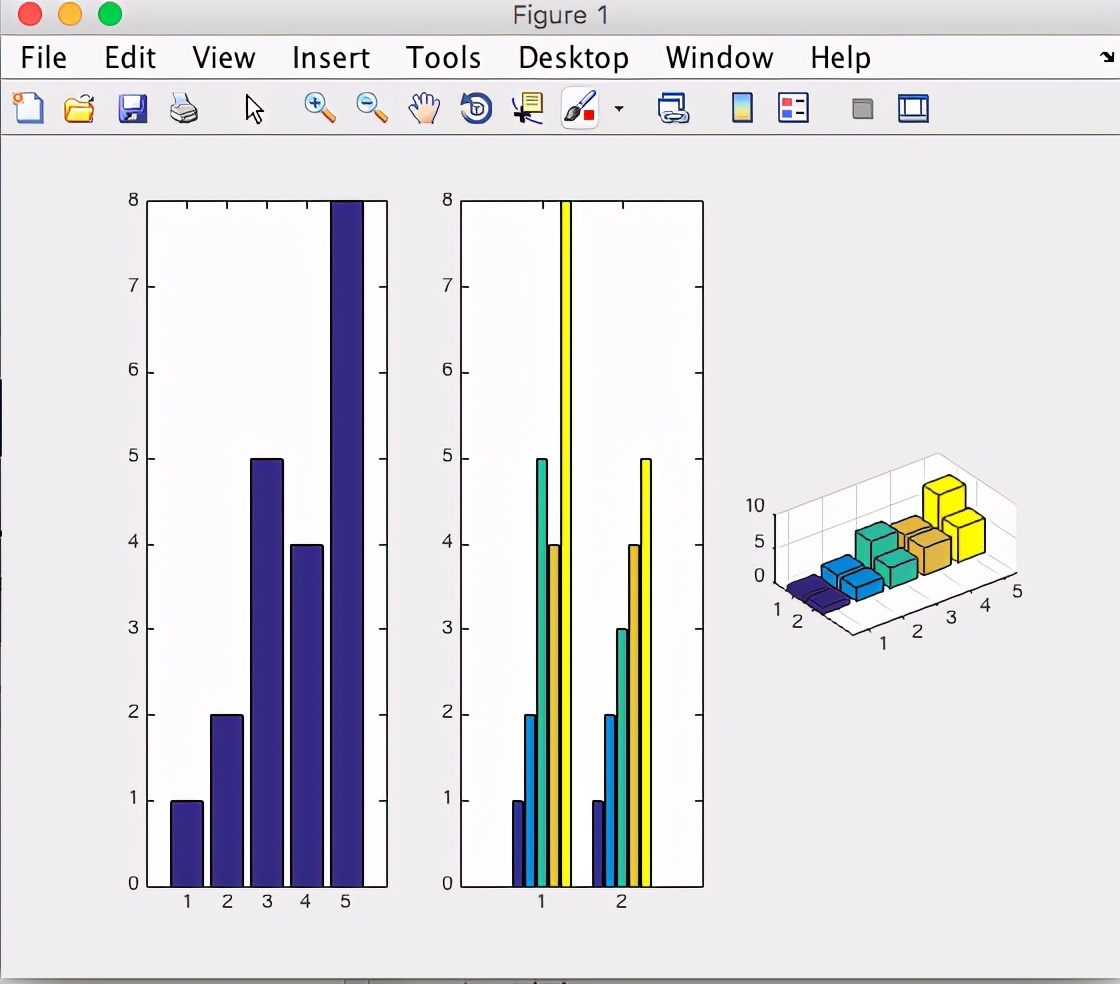
Part 2Bar chart柱状图的绘制
Bar(a):a为柱状图标准,可设置如下:
X=[1 2 5 4 8];每个长条的高度;Y=[x;1:5];Y是一个矩阵,会成为两组柱状图。
Bar3(y),绘制三维图。
Bar(a): a is the bar chart standard, which can be set as follows:
X=[1 2 5 4 8]; the height of each bar; Y=[x;1:5]; Y is a matrix, which will become two sets of histograms.
Bar3(y), draw a three-dimensional graph.
例:
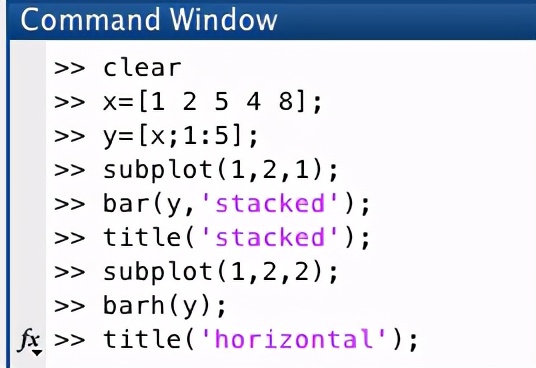
Part 3堆栈式和水平柱状图的绘制
Bar(y,’stacked’)表示压栈:这一块的高度表示其大小
Barh(y):表示水平柱状图
Bar(y,’stacked’) means stacking: the height of this block indicates its size.
Barh(y): Represents a horizontal histogram.
例:

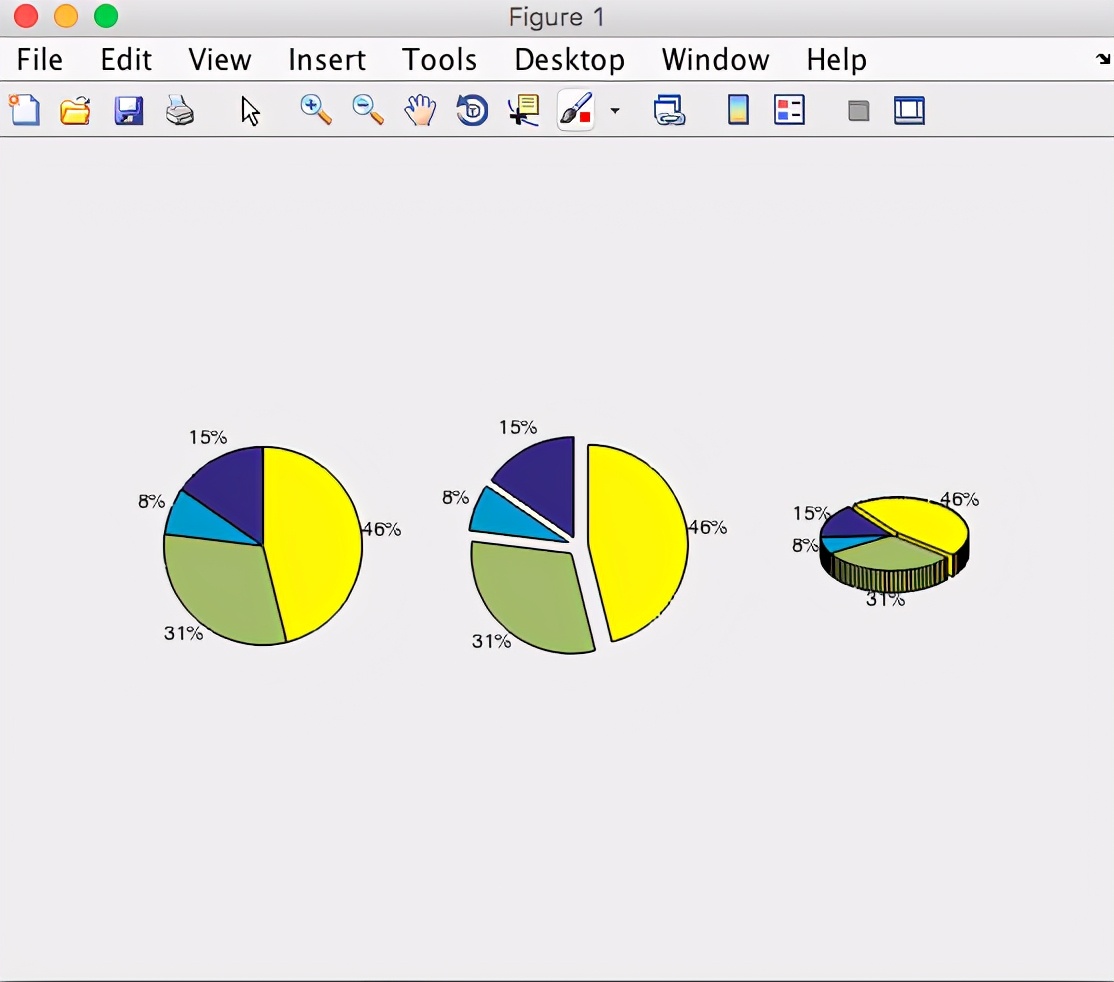
Part 4饼状图的绘制
Pie(a),a为向量
Pie(a,[1,0,0,0]),第二个参数也是向量,如果哪个位置为1,则表示饼图哪个扇形会分开
Pie3(a):三维的饼状图
Pie(a), a is a vector.
Pie(a,[1,0,0,0]), the second parameter is also a vector, if which position is 1, it means which sector of the pie chart will be separated.
Pie3(a): Three-dimensional pie chart.
例:

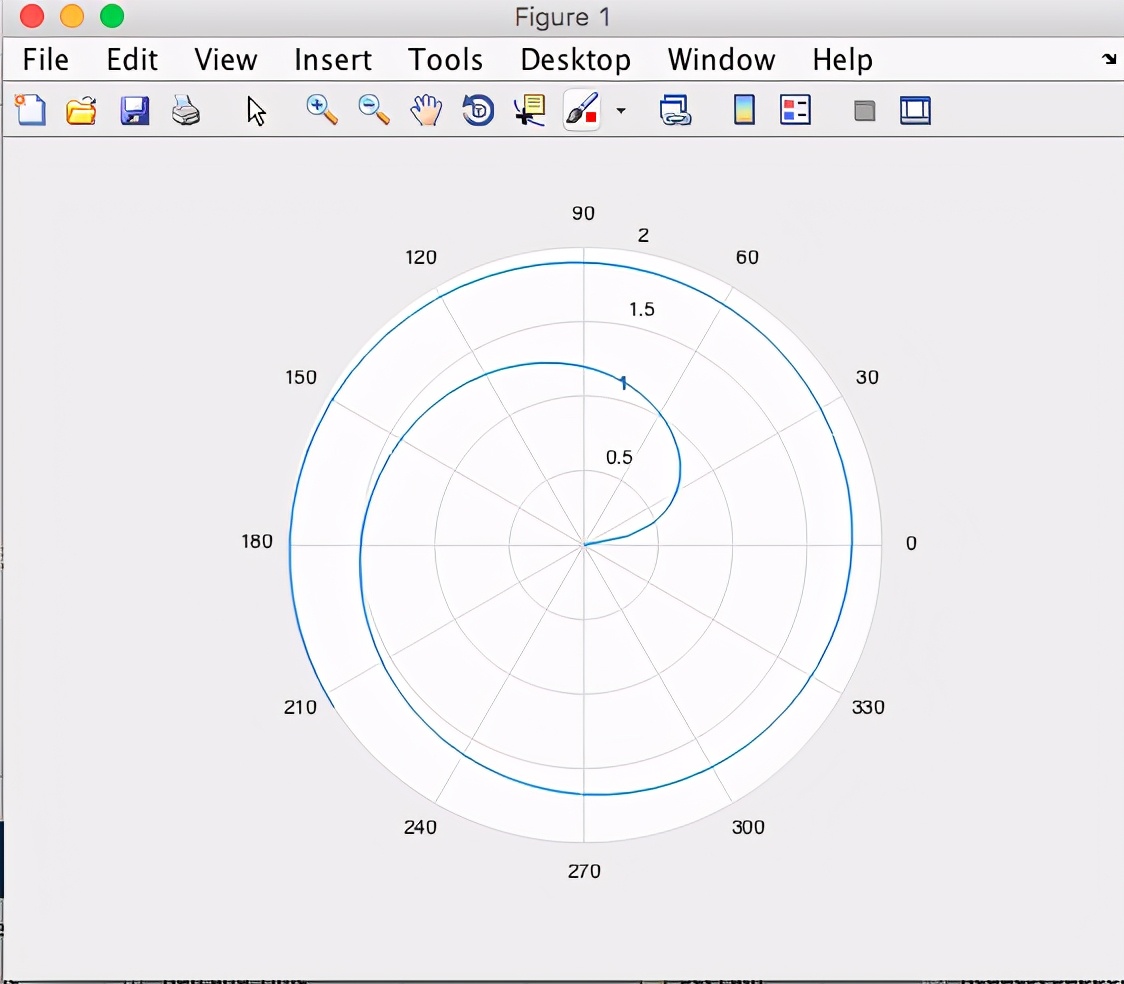
Part 5极坐标图的绘制
Polar(theta,r);theta为角度,r为半径。
Polar(theta,r); theta is the angle and r is the radius.
例:

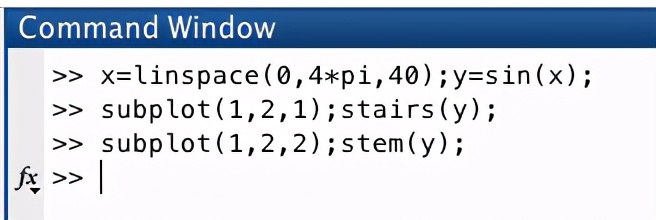
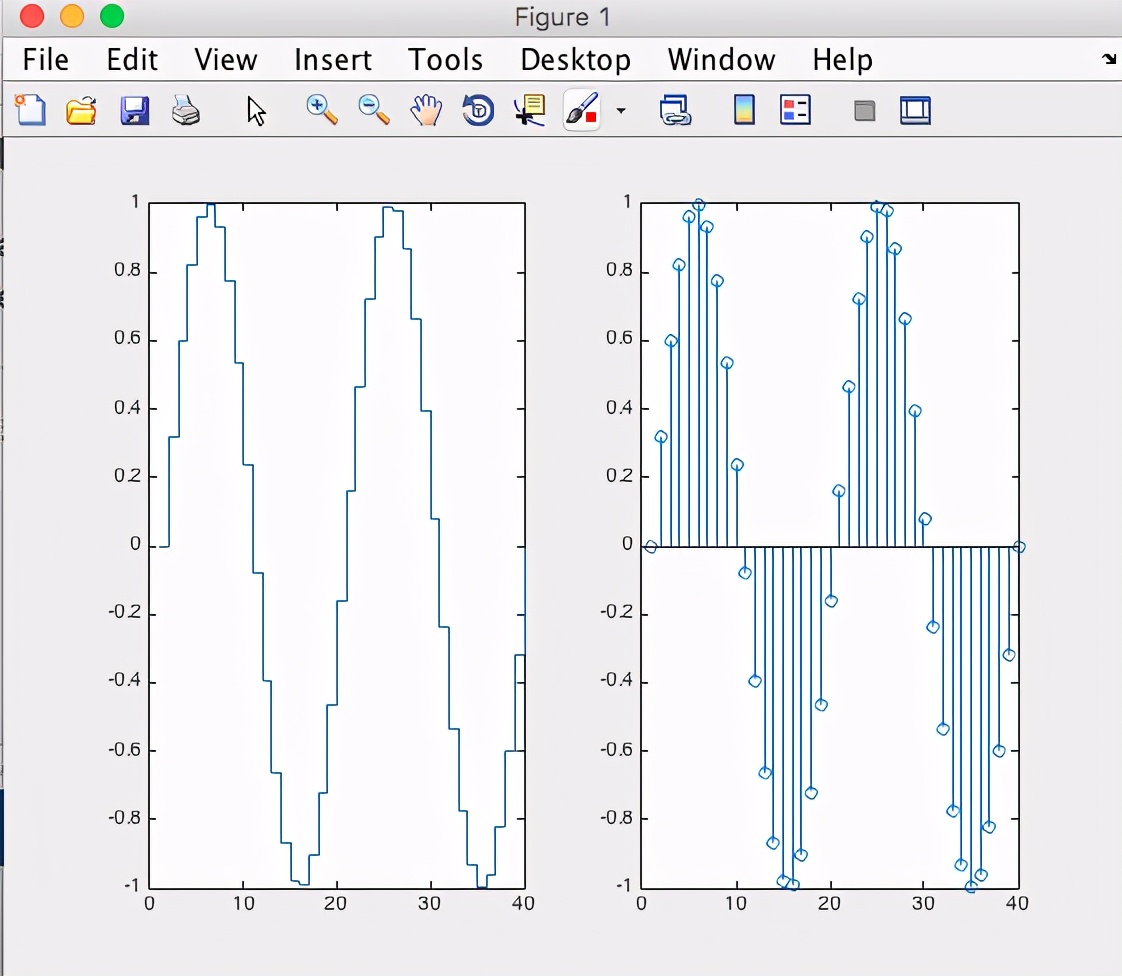
Part 6阶梯图和火柴梗图
阶梯图:stairs(y);火柴梗图:stem(y)
Ladder diagram: stairs(y); matchstick diagram: stem(y)
例:绘制sin(x)的阶梯图和火柴梗图